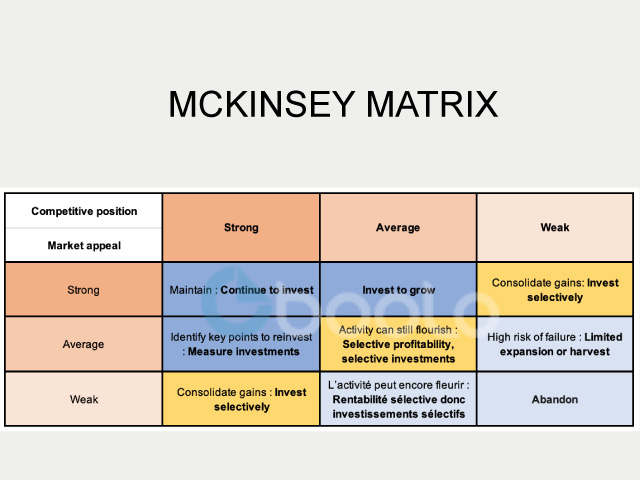
This strategic decision matrix was developed by the American strategy consulting firm McKinsey & Company and is based on a scientific method of analysis. It has been developed to help companies make decisions on the acquisition, exit and investment of sectors of one or more markets or major changes in the strategy of a company. It has been around since the 1970s.
I - Its installation and use
Its principle is based on an analysis of the strategic activity domain, i.e. “a subset which can be considered as a specific sector of the organisation”. For example, for an agro-industrial company, the dairy sector is a DAS. This includes products, customers, investors, competitors and means of production with a view to identifying the endogenous and exogenous factors present in this sector.
It is analysed according to two criteria, namely its attractiveness in the market (its size, its growth, its profitability, its barriers, the intensity of its competition, etc.) and its competitive position (the strengths of the company which depend on the share of the company's market, the evolution of this share, the quality of the products sold, loyalty, structural costs, etc.).
A. Construction
Firstly, it is necessary to evaluate the need to use the McKinsey matrix because it can require using a lot of resources to set it up.
Then it is necessary to identify the DAS intrinsic to a company and its most common criteria in relation to the means of production, technology, competition, customers, resources, know-how, etc.
Next, indicate the key-success criteria for each area of activity in the matrix. In general, it is the competitive advantages (or Key Success Factors = FCS) that make it possible to stand out, therefore, a technological or commercial value. In essence, a criterion of success is evaluated through the customer. It is, therefore, necessary to create surveys and studies. It can also be anything related to the appeal of the market (size, profitability, growth, etc.)
And finally, you have to multiply the weight and the points for each DAS which will, therefore, be greater or lesser depending on its weight on the company. The larger the circle, the more lucrative the DAS. In each circle, the weight of the company is represented, i.e. the market share held. The points of each DAS are then calculated according to their position on the matrix.
The matrix is then built around the two criteria defined above: the competitive position and the appeal of the market according to 3 levels.
B. Functioning
Thanks to the analysis of the table below, in relation to the competitive position and the attractiveness of the market, the company can thus decide whether or not to commit to the opportunities that present themselves to it with regard to:
➢ The creation or acquisition of a new market (niche)
➢ Check that a market already held is still lucrative, despite doubts about it
➢ Abandon a sector that works but is not delivering the desired results
➢ Assess the maturity of a competitor in one of its areas of activity
Thus the areas in dark blue, the keywords are strengthening and development: it is a buoyant market for the company in which it is advantageous to invest to strengthen its position in the market or develop a new activity within this market. In other words, it is a promising market.
In the areas in yellow, the rule is maintenance and profitability: the market is not buoyant. It is necessary to invest selectively to maintain the position and make the activity profitable.
And areas in pale blue, partial withdrawal or abandonment is often necessary: the market is unattractive. Depending on whether the position has strategic competitive advantages, only a partial withdrawal. Otherwise, abandonment must be the only option.
II - Matrix limits and example
A. Advantages and disadvantages
The advantages of this matrix are:
o Its consideration of several aspects based on a multi-criteria model
o Identifying and monitoring the performance of actions
o Adaptability to several business areas (services, industry, etc.)
o A clear vision of the strategic positioning within a market
o Its outlook for action
The disadvantages are:
o Its long duration by its multi-criteria
o The complexity of developing the matrix for SMEs
o Its analysis of rating criteria that are subjective
o Significant investments of resources and time
B. Example
Take the example of an agro-industrial company that wants to take stock of its business portfolio in order to invest in new niche markets. It will define criteria for evaluating its competitive strengths and market attractions such as the share of the activity in turnover, the product penetration rate, the best-selling products, the best-known products, production costs and distribution or even the rate of return of the product.
The interpretation of the table suggests that the company continue or even increases its investments in dairy products, a buoyant market within its activities.
With regard to carbonated and energy drinks, we must continue to invest in a moderate way because it is not a priority.
And the water sector is a dormant niche that is not insignificant due to the company's good competitive position in the market but must monitor the market, in order to invest optimally.
Finally, the chocolate sector can be abandoned if the company does not have a competitive advantage.
To conclude, the McKinsey matrix is an effective but laborious decision-making alternative in some respects. It is very useful to feed reflections on the positioning of a set of existing or new activities and to have a simple visual.


