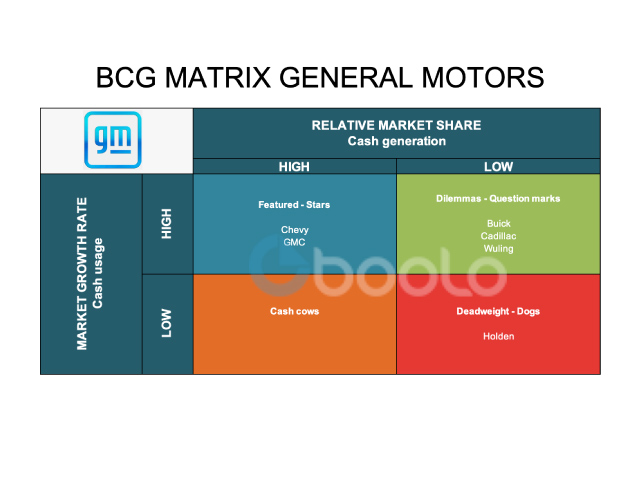
The two dimensions of the BCG matrix
Making a BCG matrix
The two dimensions of the BCG matrix
1. Market growth rate, this deals with SBU (strategic business unit), it is calculated using available data, and it measures the attractiveness of the market.
2. Relative market share can be measured with competitive strength, the most important competitors, it determines the company's competitive position.
Once these two dimensions are defined, the Boston matrix shows all the strategic business units.
Making a BCG matrix
So to make a BCG matrix, you need to define the following data first:
- Each SBU's size, and progress in the market.
- The company's, and the most important competitors, market share for each business unit.
- The company's yearly turnover for each unit.
Once these two dimensions are analysed (market growth rate and market share), you can see the y-axis (high and low growth rate) and the x-axis (high and low market shares), therefore, there are 4 quadrants:
- Stars: high relative market share and high market growth.
- Cash cows: high relative market share and low market growth.
- Question marks: low relative market share and high market growth.
- Dogs: low relative market share and low market share.
This matrix measures the balance of a company's business units. A balance must be achieved in the matrix with the implementation of relevant strategies.


